- Mean regret at nine calls, BO9 / P1
- 0.213 / 0.272
- Mean regret with one check, 9.61 calls
- 0.162
- Best measured after pairs, 11.43 calls
- 0.122
The King Arthur decision
Which actor plays King Arthur in Once Upon a Time? In one archived MuSiQue case, Mistral had eight retrieved passages and could keep up to three. Its best initial context was the Liam Garrigan biography. The additive model recommended putting the biography together with the King Arthur passage. The pair looked stronger on the singleton scores.
The extra measurement changed the decision. The pair was estimated at 1.574 and measured at 0.206. The biography alone had already measured 0.918, so the check kept it. All three scores use centered reference-answer likelihood, in nats per answer token.
-
Read the initial scores
Score the empty context and eight singletons. The biography, passage 1, is the best measured context.
BO9 {1} → U = 0.918 -
Use P1 to propose a set
The additive rule selects the biography and the King Arthur passage, using their singleton gains.
P1 {1, 5} → A = 1.574 -
Measure the new pair
The measured pair falls below the measured biography. The policy returns the biography after ten target calls.
U({1, 5}) = 0.206 < 0.918 → {1}
The decoded answer gives another view of this decision. The pair produced an exact short answer. The biography alone produced an answer with token F1 of 0.444. These two outcomes motivate tracking both measured utility and answer quality throughout the study.
A predictor can nominate the next measurement
For a context S, the target generator scores each reference-answer token conditioned on the question, the passages in canonical order, and earlier reference tokens. Let ℓ(S) be the mean of these token log probabilities. The centered utility is U(S) = ℓ(S) − ℓ(∅). One probe is one target score of a context.
The initial observation set contains ∅ and the eight singletons. BO9 takes the best measured context in that set. P1 adds singleton gains to predict the utility of a candidate subset and chooses the best prediction among the 93 feasible sets of at most three passages. Because the utility is centered at the empty set, each singleton gain is its measured utility.
P1 + one check uses the same proposal. If the proposal is a new context, it scores it once. The final choice maximizes measured utility over the initial observations and the proposal. This set contains both base choices after the check, so its best measured utility is at least as high as either. Equal scores are resolved by the smallest integer mask.
The evaluator uses the complete array only after the decision. Normalized regret is the utility gap to the best feasible subset divided by the frozen scale for the dataset, generator and pool construction. The check’s utility guarantee concerns the observed contexts. The remaining regret measures the gap to the feasible optimum.
How the nine-call choices compare
The primary comparison holds each question, eight-passage pool and generator fixed, with at most three passages in the selected context. There are 1,440 matched settings across 180 held-out questions, two pool constructions and four generators. At nine calls, the best measured context averages 0.213 normalized regret and the additive choice averages 0.272. The additive choice wins on measured utility in 324 settings, loses in 552 and ties in 564.
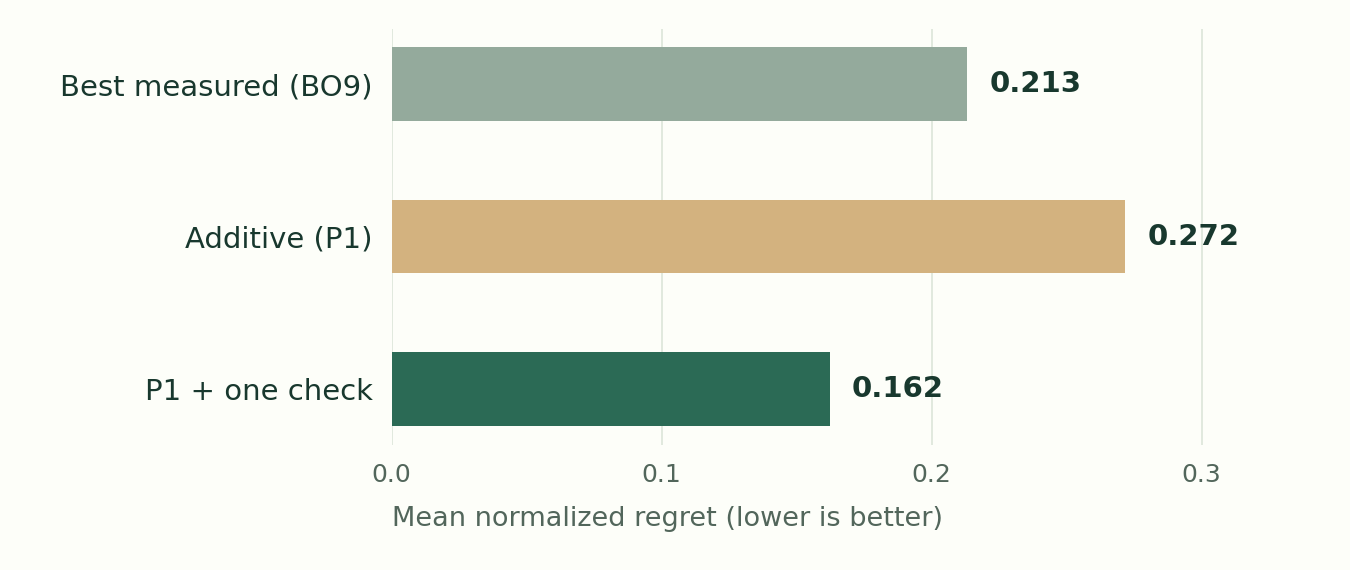
The three policies on the same 1,440 eight-passage settings with a three-passage budget. Lower normalized regret is better. The cost of each policy is in the table below.
Measuring a new proposal costs one extra call in 876 settings. Keeping the highest measured context then gives mean regret 0.162 at 9.61 calls. The paired difference versus P1 is −0.109 with a 95% interval of [−0.138, −0.085]. Versus BO9 it is −0.051 [−0.078, −0.031].
| Policy | Mean utility calls | Normalized regret ↓ | Token F1 ↑ | Answer EM ↑ |
|---|---|---|---|---|
| Best measured (BO9) | 9.00 | 0.213 | 0.586 | 0.444 |
| Additive (P1) | 9.00 | 0.272 | 0.554 | 0.422 |
| P1 + one check | 9.61 | 0.162 | 0.592 | 0.453 |
Greedy answer F1 improves by 0.038 [0.020, 0.056] against P1. The gain against the already strong BO9 baseline is 0.006 [−0.003, 0.015]. The answer exact-match interval against BO9 also includes zero. The same measurement rule can therefore produce a clear utility improvement while the answer metric shows a smaller, less precise change.
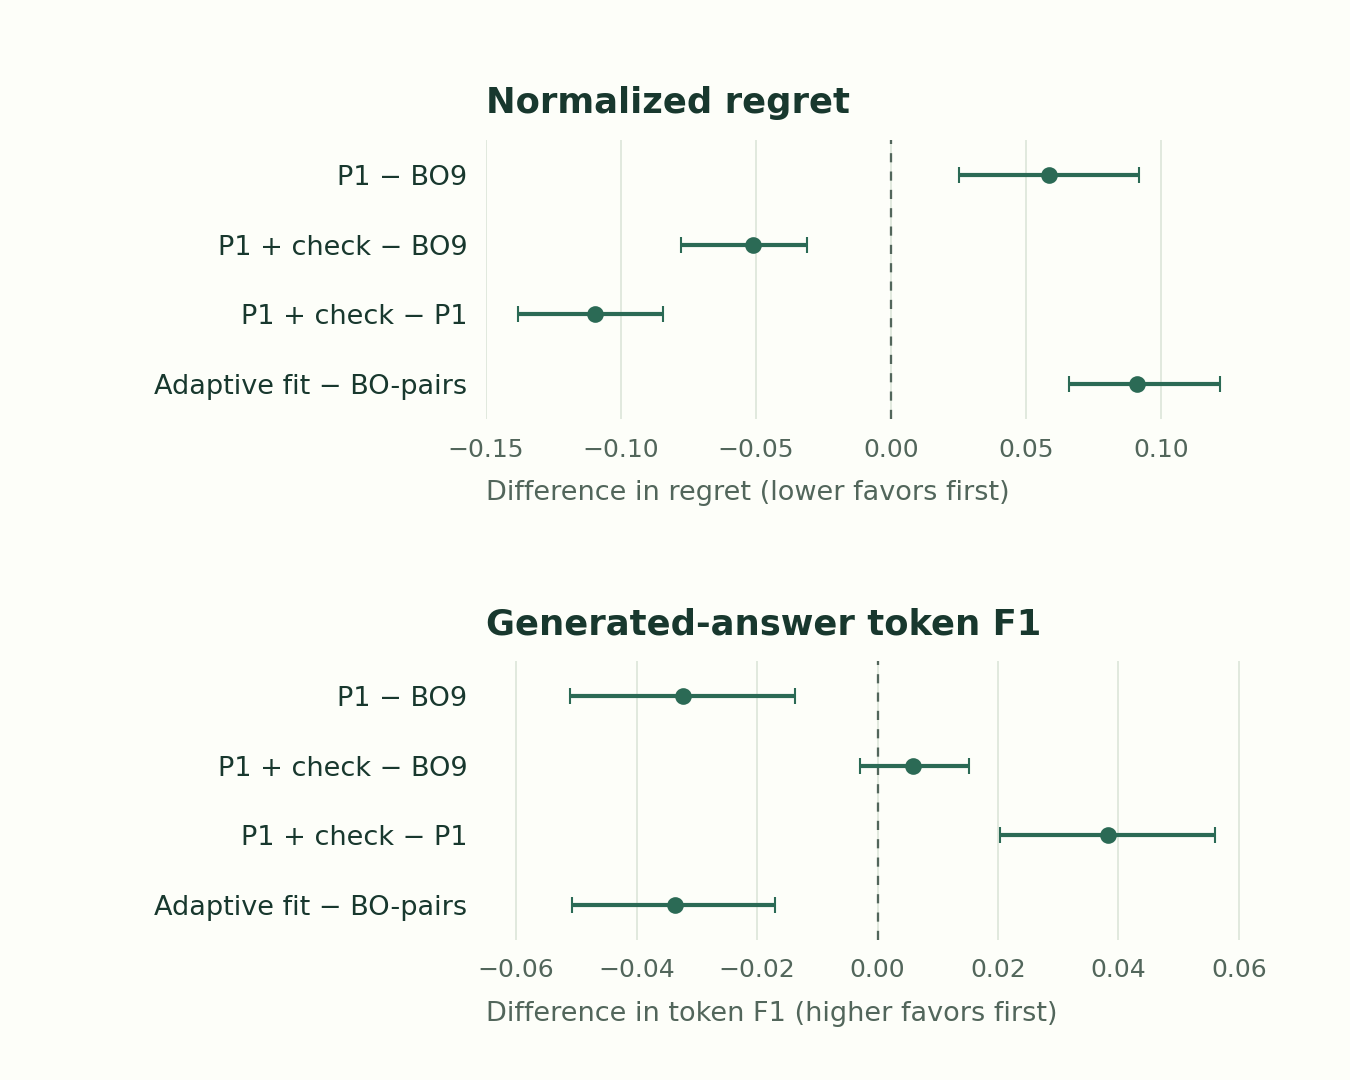
Dots are mean differences and lines show the paired 95% question-cluster bootstrap intervals. Each row subtracts the second policy from the first. BO-pairs keeps the best measured context after pair probes. The panels use separate horizontal scales.
| First policy minus second | Normalized regret Δ | Token F1 Δ | Answer EM Δ |
|---|---|---|---|
| Additive (P1) − Best measured (BO9) | +0.059 [+0.025, +0.092] | −0.032 [−0.051, −0.014] | −0.023 [−0.044, −0.001] |
| P1 + one check − Best measured (BO9) | −0.051 [−0.078, −0.031] | +0.006 [−0.003, +0.015] | +0.009 [−0.001, +0.021] |
| P1 + one check − Additive (P1) | −0.109 [−0.138, −0.085] | +0.038 [+0.020, +0.056] | +0.032 [+0.013, +0.051] |
| Adaptive fit − Best measured (pairs) | +0.091 [+0.066, +0.122] | −0.034 [−0.051, −0.017] | −0.021 [−0.040, −0.002] |
When the proposal survives the check
The other archived case asks for the birth date of the creator of A Burial at Ornans. For Qwen on this MuSiQue question, the painting passage alone measures 3.953. P1’s three-passage proposal measures 4.491, the feasible optimum, so the check keeps all three. Both selected contexts receive zero token F1.
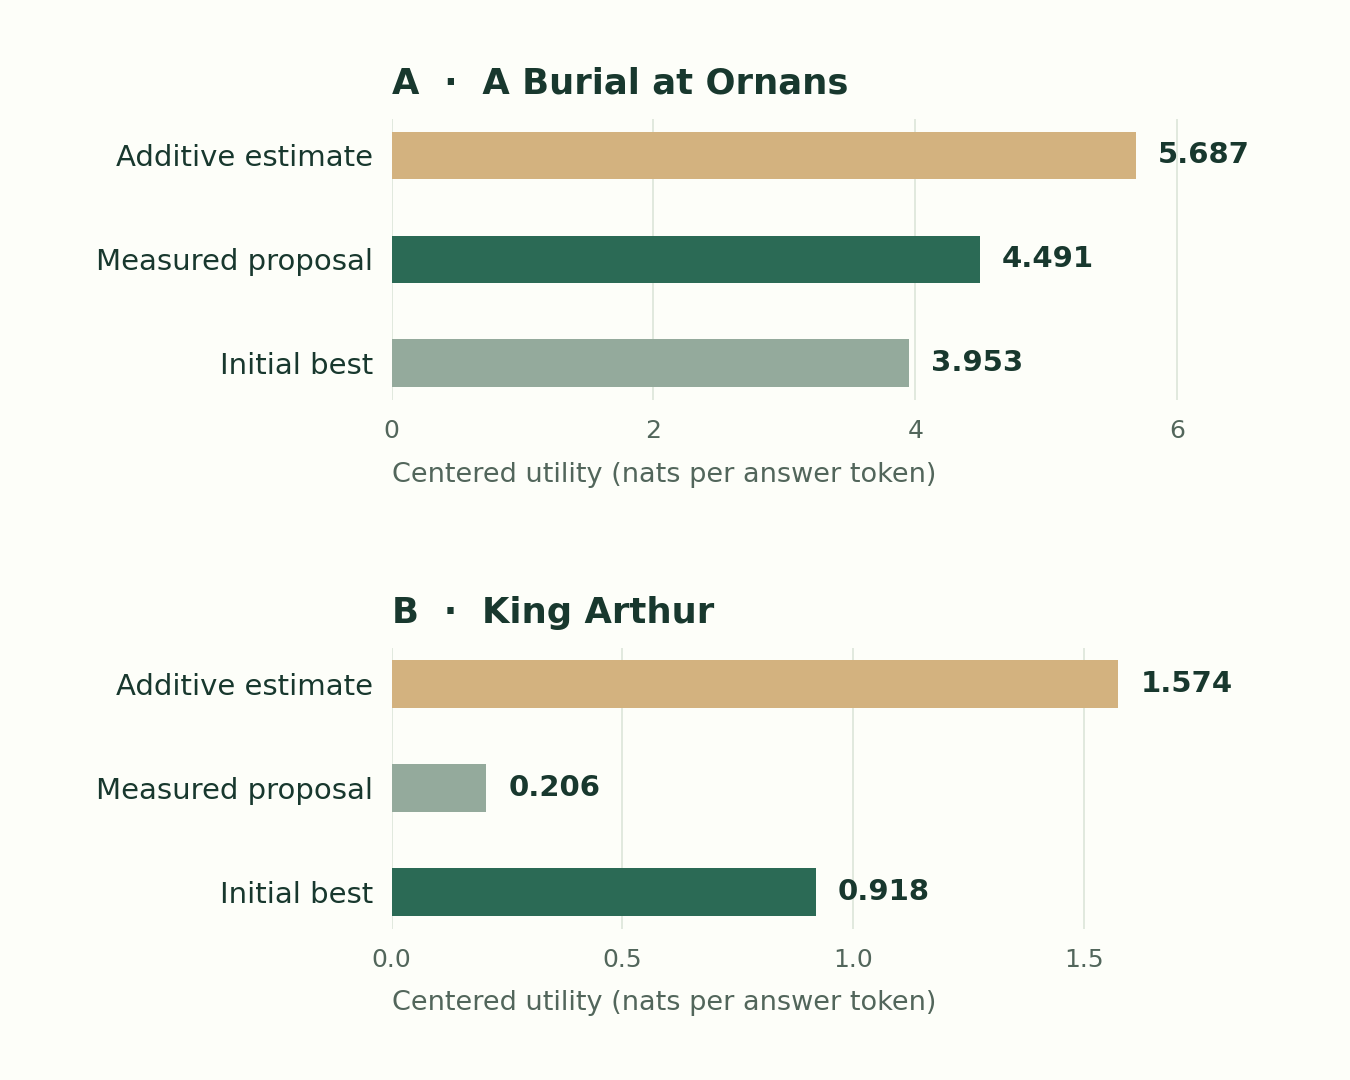
A is MuSiQue query 2hop__107905_110222 with Qwen. B is 2hop__10620_49084 with Mistral. The green bar is the context returned after the check. Each panel has its own horizontal scale.
The Ornans example and the opening King Arthur example come from 720 Track B settings. The selection rule restricts P1 to multi-passage proposals and looks for utility changes of at least 0.05 normalized regret in either direction relative to BO9. It takes the example nearest the median in each stratum. There are 105 qualifying gains and 185 qualifying losses. The table connects their archive keys to the actual decisions and answer scores.
| Case | Policy | Passage positions | Measured utility | Token F1 | Answer EM |
|---|---|---|---|---|---|
| A | Best measured (BO9) | 6 | 3.953 | 0.000 | 0 |
| A | Additive (P1) | 4, 5, 6 | 4.491 | 0.000 | 0 |
| A | P1 + one check | 4, 5, 6 | 4.491 | 0.000 | 0 |
| B | Best measured (BO9) | 1 | 0.918 | 0.444 | 0 |
| B | Additive (P1) | 1, 5 | 0.206 | 1.000 | 1 |
| B | P1 + one check | 1 | 0.918 | 0.444 | 0 |
The next measurements can reveal better contexts
The adaptive rule uses the negative no-context score as a trigger. When that score reaches the pooled development median of about 7.2883, it scores every distinct pair found in the top four additive contenders. The quadratic fit adds each measured pair’s excess utility over its two singleton scores, with unseen pair effects set to zero.
The fitted policy and best measured after pairs see the same scores and both average 11.43 calls. The fitted choice averages 0.213 normalized regret. Keeping the best of the measured contexts reaches 0.122, a paired improvement of 0.091 [0.066, 0.122]. Checking the quadratic proposal adds another operating point, 0.109 regret at 11.94 calls.
| Policy | Mean utility calls | Normalized regret ↓ | Token F1 ↑ | Answer EM ↑ |
|---|---|---|---|---|
| Adaptive fit | 11.43 | 0.213 | 0.557 | 0.429 |
| Best measured (pairs) | 11.43 | 0.122 | 0.590 | 0.450 |
| Adaptive + one check | 11.94 | 0.109 | 0.590 | 0.455 |
| Random pairs | 11.43 | 0.277 | — | — |
| Hashed subsets | 11.43 | 0.377 | — | — |
| All-pairs fit | 37.00 | 0.271 | 0.538 | 0.402 |
Two controls spend the same number of calls on hash-ordered pairs or subsets. Their mean regret is 0.277 and 0.377, respectively. Measuring all 28 pairs plus the initial nine contexts takes 37 calls. The all-pairs fit averages 0.271 regret, and its paired difference from P1 includes zero. In the matched pair experiment, the additional scores sometimes directly reveal a better context that the policy can keep.
Complex utility can still give a simple decision
A passage can lower the utility of an existing set. A pair can also add more utility than the sum of its two individual additions at the same base set. Table 4 tests both effects within the feasible domain and counts changes beyond the frozen materiality threshold. With a three-passage budget, the mean rates are 34.7% for harmful additions and 45.2% for increasing returns.
| Feasible domain | Negative marginal | Positive second difference |
|---|---|---|
| Up to 3 passages | 34.7% | 45.2% |
| Up to 4 passages | 32.5% | 39.3% |
| Full eight-passage cube | 31.2% | 35.4% |
The decision depends on interactions at the competing sets. If A is the additive prediction and I = U − A is its residual, a challenger beats the additive winner when its extra residual exceeds the additive lead of the winner. The proposed pair in the King Arthur example loses that lead once it is measured. An interaction elsewhere in the pool can be large while leaving those two contenders in the same order.
Does the check help when the pool grows?
First, the same original pools were shortened to prefixes of four, six or eight passages while keeping the selection budget at three. The checked policy’s mean regret rises from 0.074 to 0.126 to 0.162. At all three widths it has lower mean regret than the best initial measurement.
The separate matched expansion uses 20 hash-selected MuSiQue questions with Qwen and Gemma in Track B. The original eight positions are preserved and four retrieval ranks are appended. There are 40 matched question–generator settings per width and 299 feasible contexts at width 12. At that width the check reaches 0.227 regret at 13.80 calls. The best initial measurement reaches 0.275 at 13.00 calls. The paired regret difference is −0.048 [−0.099, −0.017].
| Policy | 8 candidates | 12 candidates |
|---|---|---|
| Best measured (base) | 0.252 (9.00) | 0.275 (13.00) |
| Additive (P1) | 0.295 (9.00) | 0.378 (13.00) |
| P1 + one check | 0.172 (9.75) | 0.227 (13.80) |
| Adaptive fit | 0.304 (12.82) | 0.331 (17.38) |
| Best measured (pairs) | 0.168 (12.82) | 0.184 (17.38) |
These measurements extend the comparison to twelve candidates in one retrieval setting. The four-passage comparison in the original eight-passage experiment is a separate budget check. There, mean regret is 0.186 for the checked additive choice and 0.142 for best measured after adaptive probes.
What the measurements cover
The original evaluation held out 60 questions each from HotpotQA, 2WikiMultiHopQA and MuSiQue. Track A includes annotated support and BGE fills the remaining slots. Track B uses reciprocal rank fusion of dataset-local BM25 and BGE ranks. The fixed passage representation is capped at 256 Qwen2.5 tokens. Each pool is evaluated with Qwen2.5-7B-Instruct, Gemma-3-4B-IT, Mistral-7B-Instruct-v0.3 and Phi-4-Mini-Instruct.
Regret scales are frozen from six-passage calibration arrays. The 95% paired intervals use 10,000 bootstrap resamples of 180 questions and keep the two pools and four generators for each question together. Answer F1 and exact match come from greedy decoding and normalized reference aliases. The public archive provides the scores associated with each context key.
The measured quantity requires reference answers, which places the decision rule in labelled offline evaluation. Probe counts measure target scoring calls. Wall-clock cost also depends on passage lengths and decoding. Extending the study to online retrieval would require an answer-independent utility and separate evaluation.
Run the case, then replay the paper results
The example command runs with Python 3.9 or newer and the standard library. It prints the King Arthur proposal, measured context, and recorded answer scores using the public archive. Add --case ornans to reproduce the second decision.
git clone --depth 1 https://github.com/dqswordman/rag-decision-sufficiency.git
cd rag-decision-sufficiency
python code/inspect_case.py
For the paper results, use the tagged v1.0.0 release. A clean CPU run verified 41 input hashes, matched 22 result CSVs and all four manuscript table bodies, and regenerated the regret plot. The reproduction guide identifies the settings and output file behind each paper table.
Sources & data
- Release and verification record
- Main results table
- Paired comparisons
- Data provenance and reuse
- Archived answer scores
- Evaluation protocol
- Policy replay and example selector
- Matched pool sizes and prefixes
- Interaction diagnostics
Version 1.1 · Expanded the archived examples, matched-budget comparisons, and CPU replay instructions.